Update on California’s Mystery Gasoline Surcharge
Severin Borenstein
On October 30, 2017, I published a blog and an op-ed discussing California’s gasoline price increase since the Exxon Torrance refinery fire on February 18, 2015. The data I included at that time went through June 2017. A number of people have asked me for further updates, so I have created this page to share the most recent calculations I have done. Current calculations include data through October 2017.
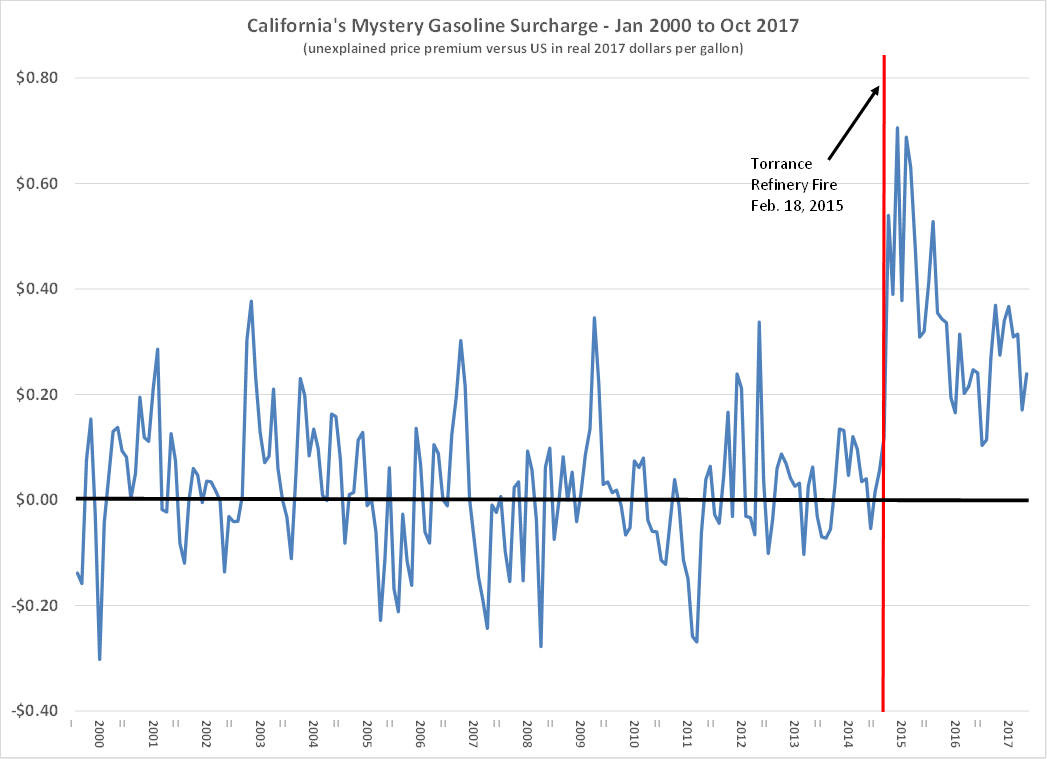
From 1996 until the February 2015 Exxon Torrance refinery explosion in Southern California, our gasoline price premium tracked closely with our higher taxes and production costs. Occasional refinery outages spiked prices, but they returned to the expected differential within a month or two, because that’s how long it takes to import our special blend from refineries outside the state. The 2015 Torrance explosion, however, has been a different story. It’s been 33 months now, and Californians continue to pay at least 20 cents per gallon more than our higher taxes and production costs could explain.
The graph below shows the differential between California’s average retail gasoline price and the gasoline price and the rest of the United States after adjusting for differences in taxes, California’s greenhouse gas fees (cap-and-trade and the low carbon fuel standard), and the extra cost of producing California’s cleaner burning (“CARB”) gasoline (assumed to be 10 cents per gallon).
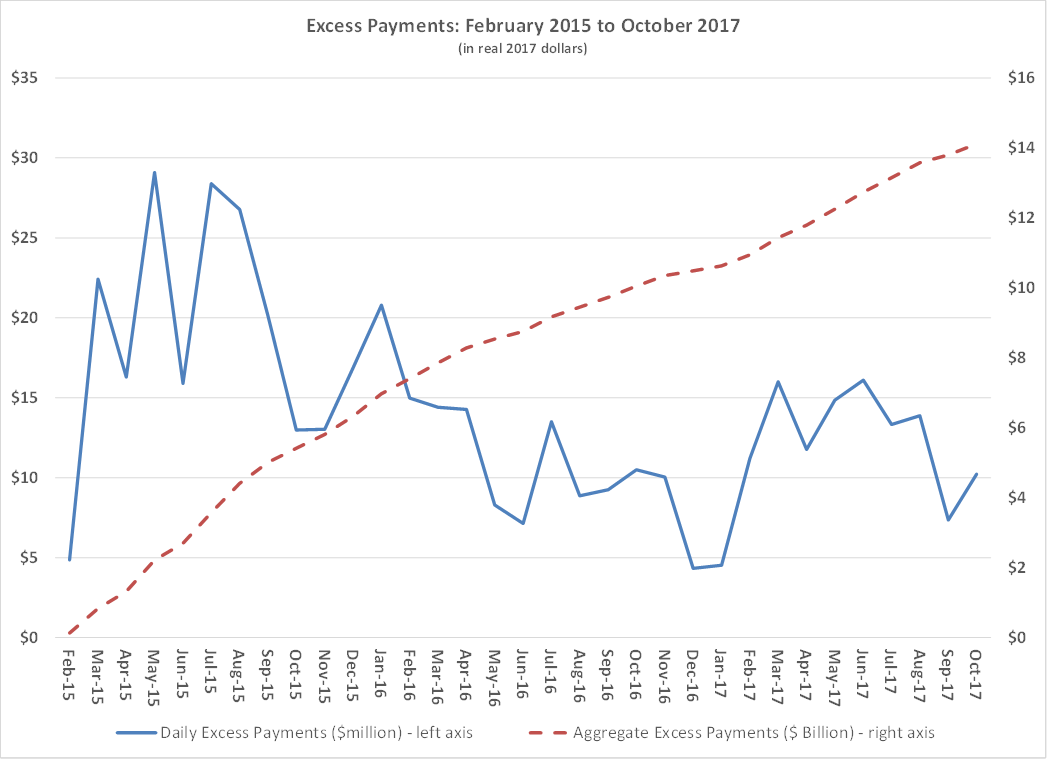
Gasoline consumption in California fluctuates throughout the year, but it is roughly around 40 million gallons per day, so even a 20 cent premium amounts to $8 million per day. The graph below shows the daily excess payments associated with the mystery gasoline surcharge, and the aggregate excess payments since February 2015. Gasoline sales data for August, September and October 2017 have not yet been released, so the last three data points are based on my estimates of consumption and will change slightly.