Estimating the Proportion of True Null Hypotheses
Jul 14, 2016 | Categorized In: Science
Last time I wrote about a comparison of the replication rates between economics and psychology, or more accurately, between economics, cognitive psychology, and social psychology. To do that I examined the difference in the distribution of p-values across areas. I was first exposed to this idea when working on a molecular genetics study, where dealing with large datasets and a large number of independent variables is the norm rather than the exception.
There, it was very natural to think about the question like, “How much signal is in this set of genes?”, as opposed to “Does this particular gene have an effect?” Part of the reason is that it is much easier to establish the former versus the latter. Similarly, we can ask for each field or area, “How much signal is in this set of studies?” rather than “Is this particular study true or false?”
BTW, I looked around briefly, but not too exhaustively, to see if someone has already addressed this question, so I may well be reinventing the wheel here.
Because I am lazy, I will use the
The common idea is that p-values under the null hypothesis is uniformly distributed, so we can estimate the departure from null by looking at the actual distribution. Replication studies are particularly useful, because unlike original publications, they provide a more unbiased distribution of the effects.
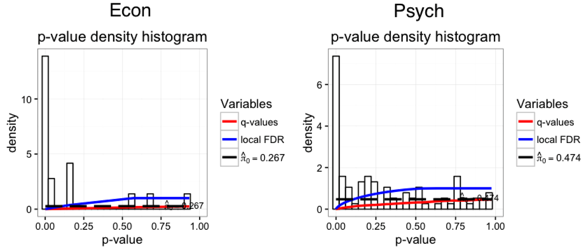
Running the q-value test, we get
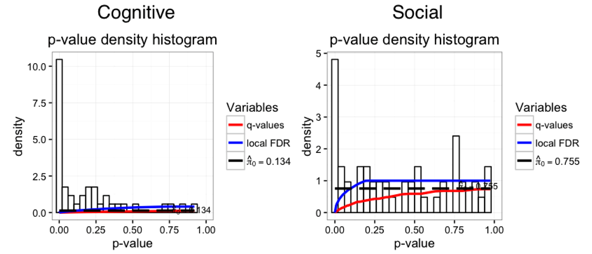
Continuing the same path as our last entry, there was a big difference between the subfields in psychology. Cognitive studies had a
Lastly, I can imagine formally testing whether the 13% true null rate is significantly lower than the 26% true null rate, but I am not aware of such a test. If anyone knows, I’d be happy to test whether cognitive psych has significantly lower true nulls than economics!
Update 7/17/2015: Anna Dreber Almenberg informed me that the psychology replication data was from Open Science Collaboration, not Many Labs. In any case, here is the dataset.
There, it was very natural to think about the question like, “How much signal is in this set of genes?”, as opposed to “Does this particular gene have an effect?” Part of the reason is that it is much easier to establish the former versus the latter. Similarly, we can ask for each field or area, “How much signal is in this set of studies?” rather than “Is this particular study true or false?”
BTW, I looked around briefly, but not too exhaustively, to see if someone has already addressed this question, so I may well be reinventing the wheel here.
Because I am lazy, I will use the
qvalue package used in the genomics field. Recently psychologists, particularly Uri Simonsohn, have developed tools along similar lines, referred to as p-curve.The common idea is that p-values under the null hypothesis is uniformly distributed, so we can estimate the departure from null by looking at the actual distribution. Replication studies are particularly useful, because unlike original publications, they provide a more unbiased distribution of the effects.
Running the q-value test, we get
pi0_econ = 0.26 and pi0_psych = 0.47. This means that the estimated proportion of true null hypotheses for economics is 26%, whereas for psychology it’s about 47%. To get an idea of why, it’s useful to take a look at the histograms. In short, there is quite a bit more mass at the larger p-values for psych than econ.Continuing the same path as our last entry, there was a big difference between the subfields in psychology. Cognitive studies had a
pi0_cognitive = 0.13, better than experimental economics! In contrast, social psychology studies had a whopping pi0_social = 0.75! The reason? A mass of social psychology studies had very large p-values.Lastly, I can imagine formally testing whether the 13% true null rate is significantly lower than the 26% true null rate, but I am not aware of such a test. If anyone knows, I’d be happy to test whether cognitive psych has significantly lower true nulls than economics!
Update 7/17/2015: Anna Dreber Almenberg informed me that the psychology replication data was from Open Science Collaboration, not Many Labs. In any case, here is the dataset.