Predicting the effects of stereotypes and biases
What was the significance of this research? What did we learn?
Our study showed how to quantitatively predict how our stereotypes about other groups affect our treatment of these groups, and addressed two important outstanding questions when it comes to stereotypes and biases.

Second is the question of comparing across the advantages and disadvantages conferred by different stereotypes. For example, do stereotypes about one being "female" affect how one is treated more than say "Hispanic"? If so, how much more or less? This is particularly challenging as there are nearly infinite ways that people can stereotype different social groups.
Our results show that it is possible to do both. The basic idea is that stereotypes change the weight we place on the outcome of others. Some stereotypes increase how much we care about someone, some stereotypes decrease it. Moreover, all stereotypes can be organized along two dimensions: warmth and competence. For example, in the US, comparing stereotypes about an Irish person and a Japanese person. The Irish person is thought of as warmer but the Japanese person is thought of as more competent.
How did you arrive at these conclusions?
We developed a computational model that took in people's ratings about others' perceived warmth and competence, as well as the economic incentives that people are faced with. We then tested how people behaved toward members of other groups in laboratory experiments involving over 1,200 participants. Specifically, the degree to which certain groups were perceived as warm or competent conferred specific amount of benefit/penalty.
We then further validated this model could predict behavior in a previously published labor market field experiment involving thirteen thousand resumes. Specifically, using people's perceptions of warmth and competence, we were able to predict the likelihood that someone would be called back when applying for a job.
Estimating the Proportion of True Null Hypotheses
There, it was very natural to think about the question like, “How much signal is in this set of genes?”, as opposed to “Does this particular gene have an effect?” Part of the reason is that it is much easier to establish the former versus the latter. Similarly, we can ask for each field or area, “How much signal is in this set of studies?” rather than “Is this particular study true or false?”
BTW, I looked around briefly, but not too exhaustively, to see if someone has already addressed this question, so I may well be reinventing the wheel here.
Because I am lazy, I will use the
qvalue package used in the genomics field. Recently psychologists, particularly Uri Simonsohn, have developed tools along similar lines, referred to as p-curve.The common idea is that p-values under the null hypothesis is uniformly distributed, so we can estimate the departure from null by looking at the actual distribution. Replication studies are particularly useful, because unlike original publications, they provide a more unbiased distribution of the effects.
Running the q-value test, we get
pi0_econ = 0.26 and pi0_psych = 0.47. This means that the estimated proportion of true null hypotheses for economics is 26%, whereas for psychology it’s about 47%. To get an idea of why, it’s useful to take a look at the histograms. In short, there is quite a bit more mass at the larger p-values for psych than econ.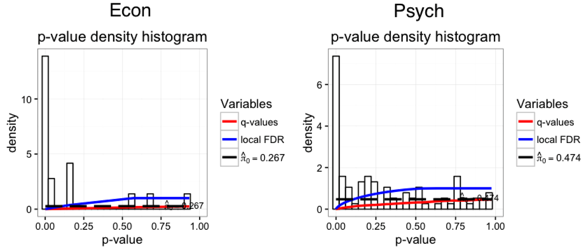
Continuing the same path as our last entry, there was a big difference between the subfields in psychology. Cognitive studies had a
pi0_cognitive = 0.13, better than experimental economics! In contrast, social psychology studies had a whopping pi0_social = 0.75! The reason? A mass of social psychology studies had very large p-values.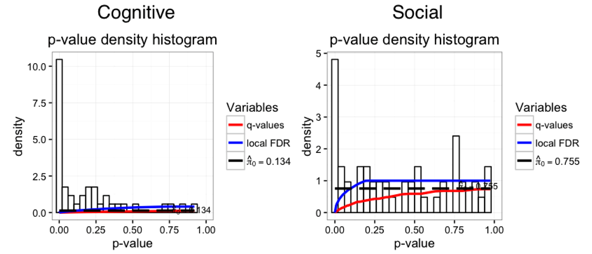
Lastly, I can imagine formally testing whether the 13% true null rate is significantly lower than the 26% true null rate, but I am not aware of such a test. If anyone knows, I’d be happy to test whether cognitive psych has significantly lower true nulls than economics!
Update 7/17/2015: Anna Dreber Almenberg informed me that the psychology replication data was from Open Science Collaboration, not Many Labs. In any case, here is the dataset.
Comparing Replication Rates in Econ and Psych
However, given that there were only 18 studies in the experimental econ set, a natural question is if the difference is “statistically significant”? A couple of psychology blogs (here and here) asked this question, and (maybe not surprisingly) came away with the answer of “no”. Euphemistically, one can say that the effects were “verging” on significance. But in this day and age, “verging” has a bit of a pejorative sense. Here is a strongly worded summary:
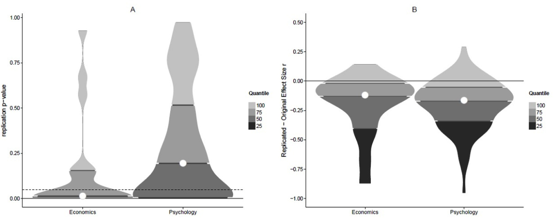
Still, it’s hard not to conclude that there are some differences between fields when one looks at the distribution of p-values such as the panel on the right from the figure below.Our analysis suggests that the results from the two project provide no evidence for or against the claim that economics has a higher rate of reproducibility than psychology.
Source: brainsidea.wordpress.com
One thing I didn’t like from the above analyses was the binary split at p=0.05. To get a clearer idea of their distributions, I plotted the empirical CDF of the p-values. Beyond the fact that there were about twice the mass at p<0.05 for economics versus psychology, there was a clear rightward shift in the p-value distribution, i.e., p-values in psychology appear to be systematically larger.
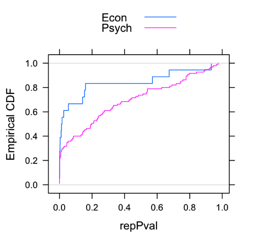
Two-sample Kolmogorov-Smirnov test
D = 0.3807, p-value = 0.0249
alternative hypothesis: two-sided
Are All Psychology Studies Created Equal?
What’s more interesting is looking at subfields. Although the economics replication studies was too small, the Many Labs replication had about 50% each of social and cognitive psychology. If one looked at the distribution of these three groups, an interesting pattern emerges. Whereas the distribution of p-values from cognitive looks like a smoother version of the ones for economics, the one for social psych looks much flatter.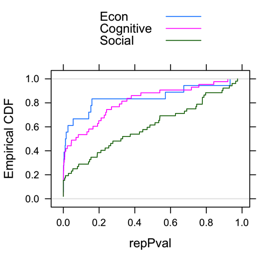
So all in all, I agree that it’s not “overwhelming evidence” that economics does better than psychology in terms of reproducibility. The sample size of 18 pretty much guarantees that, but it’s not nothing. Moreover, I think there is quite a bit of evidence that there is quite a bit of variation across fields (or subfields). If we had a few dozens areas to compare across, we would be in a much better position to say what the substantive factors are. But it seems excessive to say there is no evidence.
Full Disclosure: Colin Camerer was my Ph.D. advisor, but I think this had minimal impact here. The analyses were dead easy, and I only did this because it was curious that people got so worked up about a marginal p-value.
The Drake Equation
But this is just an excuse to talk about my favorite equation—the Drake Equation. And by “favorite" I mostly mean it is underrated and deserving of more praise, like how one would talk about an obscure “favorite” athlete or book. Because really, favorite equation?!
Part of what I like about the Drake Equation is its seeming absurdity at first glance. It is "a probabilistic argument used to arrive at an estimate of the number of active, communicative extraterrestrial civilizations in the Milky Way galaxy.”
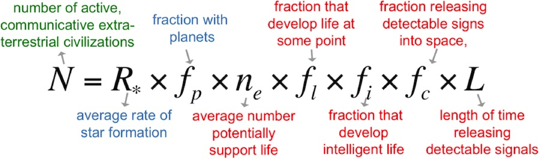
On top of being about something quite out there (oh!), it also not actually all that practically useful. Recently in an In Our Time podcast about extremophiles and astrobiology, one of the guests described in the equation in the most delightful way, that, “The number N depends on
- The average number of planets that potentially support life, which WE DO NOT KNOW.
- The fraction that develop life at some points, which WE DO NOT KNOW.
- The fraction that develop intelligent life, which WE DO NOT KNOW.
- The fraction releasing detectable signs into space, which WE DO NOT KNOW.
- And the length of time releasing detectable signals, which WE DO NOT KNOW.”
But far from being a failure, it has in fact been incredibly influential. Why? Because it breaks up a daunting problem into more manageable pieces, some more manageable than others. A generation ago, we did not know the average rate of star formation, or the fraction with planets, but now we have decent ideas of those. And one can imagine that we will either find out what some of the other terms are, or break those into manageable problems that we can solve.
Simply put, the Drake Equation provides the scientific community with a strategy to make systematic progress on a difficult question. More than difficult in fact, on what is an impossible question to address with current technology.
So when I hear blanket criticisms of applying basic sciences to business or societal problems, I take heart in the fact that Frank Drake and his coauthors were able to provide a sensible scientific framework for such a seemingly absurd question.
New paper on culture and genes
Briefly, northern China largely relies on wheat-based cultivation, whereas souther China is largely rice-based. There are also pretty profound cultural differences. But up until now nobody bothered to quantitatively link the two and provide some rationale for why they might be connected. You'll have to read their paper for the full story, but for me it makes an incredible amount of sense, and also explains some of the regional stereotypes that every Chinese speaker would know by heart.
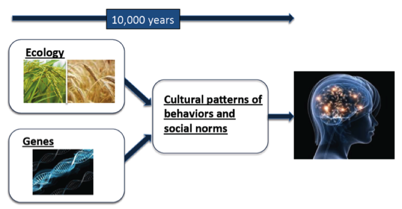
1 Kitayama, Shinobu, Anthony King, Ming Hsu, and Israel Liberzon. “Dopamine-System Genes and Cultural Acquisition: The Norm Sensitivity Hypothesis.” Current Opinion in Psychology.
Learn the rules before you break them!
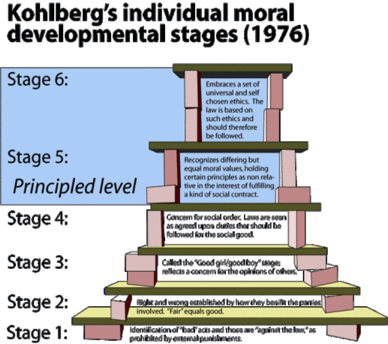
It’s the age-old rule of “learn the rules before you break them”. The problem is, different people have different standards for what “learned the rules” mean. It reminds me of the famous Kohlberg’s system on moral development stages. As children, we first learn what’s morally good and bad. Next we learn to apply these rules and apply them strictly and without exception. Finally, we learn to tradeoff between the various rules that may be in conflict.
The system holds up pretty well if we change the words “moral” to “statistical” or “data-driven”. For many people, going from Stage 4 to Stage 5 is frightening, since one is leaving the clear black and white world of rules and order. The most challenging as an instructor are those who think they are at Stage 5 but actually at (say) Stage 2. The only one we need to add is a Stage 0, which corresponds to “Stats? What's stats?”.
What do Donald Trump and gay marriage have in common?
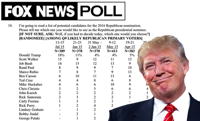
Here’s another. In both cases, everyone has a story about why that is. In Trump’s case, one I particularly enjoy is that voters are using their stated support for him to air grievances about their larger dissatisfaction, almost kind of like punishing yourself after a bad breakup.
In gay marriage, the thinking among some people is that there is a social desirability bias against opposing gay marriage.
Here’s the final one. In both cases, the stories given are quite precise and plausible (to me at least), but unfortunately neither has much support in terms of actual evidence.
Science of Business, Business of Science
What is this blog about?
Two things.
1. Science of business: How can we use science to improve the current state of managerial practice, foster innovation, and reduce ethical violations? This includes scientific thinking for example through the use of data and experimentation. It also includes attempts to introduce entirely new types of data from the natural sciences, such as neuroscience and genetics. What are the areas of promise, of hype? How should we evaluate claims? How can we make progress?
2. Business of science: How can we improve efficiency and effectiveness of current scientific enterprise? Scientists are increasingly being asked to show the bottom line impact of their research, but how should we measure value of scientific research? How do we balance competing demands of basic and translational research?
Why do we need yet another blog about this?
Because these topics don’t seem to be discussed much in the blogosphere. Email me if you think someone is doing it better. I will either a) try harder, b) fold and use the time for something more productive, or (c) respond with some snarky defensive response (I kid, I kid!).Why are you qualified to write this?
Through some interesting and not-so-interesting career quirks, I ended up with training in economics, neuroscience, and psychology, and am now teaching at a business school. This means that I spend part of my day wearing my bschool hat, which involves me thinking and teaching marketing, especially topics like marketing research and the role of data in business. The rest of the time is spend with me wearing my basic scientist hat, where I direct the Neuroeconomics Lab, where my research team and I conduct research on the neuroscience and genetics of economic decision-making.Over the years, I find myself increasingly comfortable at putting on my bschool hat while thinking about science, and putting on my science hat while thinking about business. I’ve also come to realize that there is a lot of each area can learn from the other, hence this blog.